

The McGlashan
-
Posts
695 -
Joined
-
Last visited
Content Type
Profiles
Forums
Events
Posts posted by The McGlashan
-
-
Availability of credit is down. Price of credit is increasing.
*cut for brevity*
I criticise you for relying on opinion rather than facts, and you just provide more opinion.
Opinions are ten-a-penny, here's one (in the self-same article you cited) from another former BoE MPC luminary whom you once lionised for his prescience in calling for early and aggressive monetary easing last year:
Professor David Blanchflower, who recently left the Bank of England's monetary policy committee, wrote last week that we should not get carried away. "House prices still have a long way to fall. It should be remembered that during the period of declining house prices of the early 1990s, approximately one month in three house prices actually increased."Why didn't you quote Blanchflower this time? Don't you like what he's got to say anymore?
WRT supply/demand, the RICS long term sales-to-stock ratio is 36%. It currently stands at 20%. There is no relative supply shortage. There's a buyer shortage.
-
Laptop Computer, �499.....
Internet connection, �19 per month....
BBC News site access, free....
Seeing a Nobel Prize winning Economist discredit the bears repeated assertions of continued doom and gloom for the UK economy, PRICELESS.....

Once again, Hamish slavishly parrots the catchphrase of a TV advert as a substitute for his own wit or creativity. This tells us a great deal about his capacity for independent thinking and his openness to suggestion. By allowing the repetition of TV advertising to affect what he himself outputs he has created for himself a crucible of credulity where conviction is valued over information and confirmatory opinion carries more weight than data.
What has Krugman's opinion got to do with Aberdeen house prices? I don't know whether Krugman's right or wrong, but what I do know is that the availability and price of credit have a much greater effect on house prices than do newspaper articles.
-
Strange, I could have sworn the latest indices show it going up now.....

No, that's not right. BoE says it's down again.

-
Recession is an economic term for when the economy is in contraction for at least two quarters, if the economy stops contracting and starts growing even at a very low rate the recession has ended by definition.
If the National Institute of Economic and Social Research are correct then the economy started growing in April, if this is confirmed in the GDP figures for Quarter 2 then the recession has ended.
Unfortunately so many economic illiterates band the word about without actually having the slightest idea of what Recession actually means!
Were you to have actually read the NIESR press release, you might just pick out the facts of what they are projecting.
http://www.niesr.ac.uk/press/gdp0609.pdf
The projected figures published by NIESR show an estimated GDP increase of 0.2% for April and 0.1% for May. The projected month-on-month uptick is made up almost entirely from growth in Public Services during these 2 months (and a very small growth in Agriculture in April).
They also say:
"Our track record in producing early estimates of GDP suggests that our projection for the
most recent three-month period has a standard error of 0.1-0.2% point when compared to
the first estimate produced by the Office for National Statistics."
The report also points out that the quarterly annualised figures remain negative at -6% for April and -3.6% for May.
-
Were the commentariat to have actually read the NIESR press release, they might just pick out the facts of what they are projecting.
http://www.niesr.ac.uk/press/gdp0609.pdf
The projected figures published by NIESR show an estimated GDP increase of 0.2% for April and 0.1% for May. The projected month-on-month uptick is made up almost entirely from growth in Public Services during these 2 months (and a very small growth in Agriculture in April).
They also say:
"Our track record in producing early estimates of GDP suggests that our projection for the
most recent three-month period has a standard error of 0.1-0.2% point when compared to
the first estimate produced by the Office for National Statistics."
The report also points out that the quarterly annualised figures remain negative at -6% for April and -3.6% for May.

-
I said that there is almost unanimous agreement from economists and commentators that the worst is behind us.
Source?
-
Were the OP to have actually read the National Institute of Economic and Social Research press release reported in the Indie, he might just pick out the facts of what they are projecting.
http://www.niesr.ac.uk/press/gdp0609.pdf
Firstly, they say:
"Our track record in producing early estimates of GDP suggests that our projection for the
most recent three-month period has a standard error of 0.1-0.2% point when compared to
the first estimate produced by the Office for National Statistics."
The projected figures published by NISER show an estimated GDP increase of 0.2% for April and 0.1% for May. The projected month-on-month uptick is made up almost entirely from growth in Public Services during these 2 months (and a very small growth in Agriculture in April).
The report also points out that the quarterly annualised figures remain negative at -6% for April and -3.6% for May.
Here is a picture of what the NIESR figures look like:
-
Approvals up, value down.

-
Hamish would become less angry and abusive if he faced fewer rebuttals to his assertions. This could be achieved were he to apply a little more circumspection to his speculation.
For instance, he has jumped upon yesterday's and today's reporting of a press release from the National Institute of Economic and Social Research. It is, of course, perfectly understandable that the media should report this one think-tank's most recent press releases. but for Hamish to say that this is:
almost unanimous agreement from economists and commentators.is quite a stretch.
Were Hamish to have actually read the NISER press release, he might just pick out the facts of what they are projecting.
http://www.niesr.ac.uk/press/gdp0609.pdf
The projected figures published by NISER show an estimated GDP increase of 0.2% for April and 0.1% for May. The projected month-on-month uptick is made up almost entirely from growth in Public Services during these 2 months (and a very small growth in Agriculture in April).
They also say:
"Our track record in producing early estimates of GDP suggests that our projection for the
most recent three-month period has a standard error of 0.1-0.2% point when compared to
the first estimate produced by the Office for National Statistics."
The report also points out that the quarterly annualised figures remain negative at -6% for April and -3.6% for May.
It is also worth pointing out that the figures are for the UK. There is no indication of Scotland's performance. As we all know, the recession here started at least a quarter later than the UK as a whole.
-
Is it morally wrong to research any market before making a major purchase?
Is it morally wrong to use a price comparison website?
Am I just a 'predatory buyer'?
-
Area is everything in Dundee! That one is around the Stobswell area of Dundee. Outside the city centre, so no student interest. A lot of addicts in BTL's around there. 2 schools close-by, no parking plus a view over council buildings! Doubt you'd get 99k for it in good nick!
As to prices overall, not seeing massive drops from peak, 10-15% seems about right. This flat is more the desirable end of the market, close to me. Cut and paste in.....
http://www.tspc.co.uk/x91032-3-bedroom-Fla...undee---DD3-6TU
Fixed at 190k (and a few 'sticky' properties around that area) from a peak of @220k)
Your point about location is fair enough, but Notting Hill was full of junkies and transients in the late 80's. My taste is perhaps a little more non-conformist and 'bohemian' than that of those who would regard the hospital conversion cells as being 'desirable'.
"Desirable" - are you joking?
Pics from the schedule.
Beautifully landscaped, south facing balcony:

Mind your head!

'Double Bedroom' 2. No it isn't, its 9' wide FFS!

'Bedroom' 3. No it isn't. It's a cupboard. 'Large Window'. No it isn't.

Still, it must be worth what they're asking. It's got laminate flooring and recessed lighting!
-
McGlashan - that graph is interesting.
If you liked that one, you'll love these:
Edinburgh Quarterly Sales Volume:

Edinburgh Total Quarterly Market Value:

An astonishing speed and magnitude of collapse.
The total value of all sales in Q3 07 was £1.1bn. This fell to only £216m in Q1 09. A staggering 80% drop in 18 months.

-
Re Crash in Dundee.
I would agree about commutable (just) to Aberdeen, and property is certainly cheap. I'm always surprised at how many commuters there are to London City as well, I used to take the early ScotAir flight down quite often, direct and convenient to the city centre.Absolutely - and in free-fall.
This fixer-upper 3-bed maisonette was o/o £130k last week. Now FP £100k
[/digs out debit card, counts loose change]
-
What the commentariat generally fail to report in any detail is another statistic from the RICS: the sales-to-stock ratio.

While it's true that this measure has risen in the last few months (it's now at 20%), it remains at a historic low since the RICS first started measuring it, and is significantly below its long run average of 36%.
-
What the BBC and others fail to report is another statistic from the RICS: the sales-to-stock ratio.

While it's true that this measure has risen in the last few months (it's now at 20%), it remains at a historic low since the RICS first started measuring it, and is significantly below its long run average of 36%.
-
But luckily Aberdeen is immune.
Cue McTavish.
Here is a picture of what that immunity looks like:

-
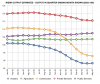
There was much hoopla in the commentariat when last month's BoE and CML mortgage lending figures (for March) ticked up. Yet I noticed nothing to report that the gradient had turned down again when figures were released this month.
Source: BoE
-
For sale on ASPC:
Today (8 June 2009)
For sale : 1163
Added in last week : 71 (6%)
Added in last month : 317 (27%)
Over a month : 846 (73%)
And for lease: 284
Added in last week: 29 (10%)
Added in last month: 122 (43%)
Over a month: 162 (57%)
-
...the credit crunch is finally easing
No it isn't. Not for the first time, it is clear that you have underestimated just how much liquidity the banking crisis has destroyed. Opinions from the commentariat are ten-a-penny, but facts are unique.
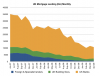
Take a look at the BoE Mortgage lending figures. True, there was an unremarkable uptick in March, but the gradient is down again for April.

The figures for total lending to individuals (incl. CC's, OD's, personal loans, HP, etc) are truly blood-curdling. Lending has totally collapsed, the fibrillating fluctuations over the last few months are within a range significantly lower than total lending in 1997. This patient is in the HDU. Recovery will be long and slow.
 ...and the price of Oil is rocketing upwards again.
Well, it's certainly not 'good' that the price of oil has been rising. Another spike in the oil price will be a significant hurdle to jump for those attempting to stabilise the world economy. From your bullish standpoint, it wouldn't be a reliable mechanism to support rising house prices in Aberdeen either. Another oil price spike would, of course, lead to many difficulties for all businesses and individuals in the world economy, risking stagflation and leading to further demand destruction and another oil price crash. And repeat like this:

However, I don't think that this most recent bull run in the oil price has been caused by the tsunami flows of hot money which led to last year's super-spike - there were too many burnt fingers last time round for this to happen again.
I reckon that this bull run is nearly exhausted. You'll get a rare prediction from me here.
(Not my own work)
http://321energy.com/editorials/bibbings/bibbings052109.html
Slightly bullish / Neutral immediate term - next few weeks (US summer driving season - refineries pushing longer production runs - balanced by re-strengthening dollar) Upper $60's / Low $70s?
Bearish short term - autumn (economic realities) $40 - $55
Bearish medium term - 1 year (demand destruction) $25
Bullish long term 2-3 years (economic recovery, resource depletion and capacity constraint) $100+ who knows?
-
While I was compiling the data for the RoS Quarterly graphs, I identified some other interesting stats:
Aberdeen City Quarterly Sales Volumes. Now lower than any point in the published data set.

and
Aberdeen City Total Quarterly Market Value. Again, now lower than any point in the published data set.
This is the most bearish thing I have ever seen in relation to the Aberdeen housing market. The total value of the market has declined by an astonishing amount with incredible speed. It is down by an eye-watering 74% in the last 18 months.

-
Thanks Bailey, that was very helpful.
So it is clear that the spring bounce in Scotland started long before spring. The positives we are seeing now occured long before April.
Excellent news, I'd say.
Thanks are indeed due to Bailey for his searing insight into the busy and efficient working days of the legal 'professionals' on whom we are compelled sometimes to rely.
However, what Bailey tells us about your posited 'lag' amounts only to surmise and hearsay, and your triumphalism is, as so often, misplaced.
It would be better for us to look to uncontroversial facts which are in the public domain for all to see. Bailey tells us that SPC stats are probably most relevant, fair enough, let's have a look at ASPC and make a direct comparison to RoS Aberdeen. By doing this, we can see just how statistically significant this 'lag' is.
http://www.aspc.co.uk/Info/houseprices.html
http://www.ros.gov.uk/productsandservices/lpd_stats.html
Bear in mind that ASPC data are quarterly and RoS data are monthly. We should also bear in mind that ASPC figures are for the 'Aberdeen housing area', which includes large parts of Aberdeenshire whereas the RoS figures are for the Aberdeen City municipal area only. Similar economic circumstances, of course, affect both sample areas.

The two data sets track each other pretty well. On the points of inflection where we can see a lag between ASPC and RoS, it is only of one month. For instance, the ASPC stats show a peak in the Q2 07 figures, released in July 07. The RoS track this peak, and show it in the July figures, released in August.
However, it was not clear from the ASPC stats alone that this was, indeed, a peak until the next quarterly figures were released in October 07. The RoS enabled us to identify the peak when their August 07 figures were released.
Similarly, following the second peak of Aberdeen prices at Q2 08, RoS data showed us that prices were declining as early as August that year. This was only confirmed by ASPC data released in October.
So, any minor statistical lag in the RoS data is more than overridden by the infrequency of releases from ASPC. As ASPC data are released only quarterly, it is perfectly valid for us to look to the RoS data for snapshots in the intervening periods.
-
Very interesting. I do agree. Getting excited by a rise, or a fall, based on one months data seems a little futile. This goes for bulls and bears.
8 monthly falls between 2005 & 2007. Wow. Quarterly YoY figures are the only real decent indicators.
Here you go:

from this:

-
No, thats not right.
Last years spring/summer bounce lasted from April to July. And was approximately a 9% rise.
Suit yourself, we're both right - dependant upon the time-horizon chosen. The figures are in the public domain.
I'll not bother responding to the rest of your pedantry - the thrust of what I said was true in the context of brevity and asking you a simple question (why you think falls to Sept this year will be less than those which the figures show last year), to which your answer was:
...the rate of unemployment increase is slowing dramatically at the moment...Things are improving rapidly. Sentiment has changed, and consumer confidence is rising.. Most commentators now believe the worst of the falls are well behind us, both for the economy, and house prices.
LTV's are increasing, mortgage approvals are rising, lending criteria are loosening, QE has resulted in increased liquidity in the system.
Things genuinely are getting better. We're not there yet, but we are getting there.
I'd be quite content with 9% by July. But it may well be more. Last year economic conditions were worsening. This year they are improving. Last year mortgage availability was worsening, this year it is improving. Last year consumer confidence was declining. This year it is improving.
A morbidly obese patient puts on 14 kilos over 2 months.
The doctor tells him to lose some weight or face serious health consequences.
He re-visits the doctor 2 months hence.
He has gained 7 kilos in that time, and cannot understand why the doctor remains concerned.
"My rate of weight gain has decreased, so my health outlook must be better!"
Big Macs all round.
On what do you base your expectation that falls in the second half of this year, after the bounce, will not be smaller than last years falls?I haven't said what my expectations are.
-
Yes I've heard this also, but a 3 month lag on April results would mean prices started rising based on offers accepted in January/February. Which seems a little optimistic to be honest.
If that was the case, then the 2% uplift for Aberdeen reported in April would have happened around the time of significant layoffs, low oil prices, mild panic in the oil industry, doom in the local media, a tragic fatal helicopter crash, and the worst snow in years. Seems unlikely to me.
I assume you meant Q2....
I'm trying to get to the bottom of the lag to find out if it's actually a Q1 bounce that breaks with tradition, or a Q2 bounce and the RoS stats are not as laggy as we thought.
If ESPC or Bailey is reading, input would be welcomed on this issue.
Lag? Discussion is moot. The RoS data are specifically and expressly compiled reflecting the date transfer of title took place. This is clearly some days after an offer was accepted by the vendor, we cannot know by how much. Other indices give no guidance on how their data are compiled.
However, what we can know with certainty is that the conveyancing workload is half of what it was last year and a third of what it was the year before.


Aberdeen, Aspc Stats
in House prices and the economy
Posted
For sale on ASPC:
Today (15 June 2009)
For sale : 1150
Added in last week : 71 (6%)
Added in last month : 309 (27%)
Over a month : 841 (73%)
And for lease: 291
Added in last week: 28 (9.5%)
Added in last month: 127 (45%)
Over a month: 164 (56%)
No significant proportional changes.