Latest House Prices UK Data: Average House Prices UK with Regional Graphs

House Prices

Last Updated: 15/02/2024

The House Price graphs show data for UK Average House Prices, UK Annual Change in House Prices including Regional House Prices for England, Scotland, Wales & Northern Ireland. Also included are Regional House Prices for England. 

Latest Sold House Prices Data [Dec 2023]

  • The average price of a property in the UK was £284,691
  • The annual price change for a property in the UK was-1.4%
  • The monthly price change for a property in the UK was 0.1%
  • The monthly index figure (January 2015 = 100) for the UK was 149.3

Average House Price UK

UK Average House Prices
UK Annual House Price Change

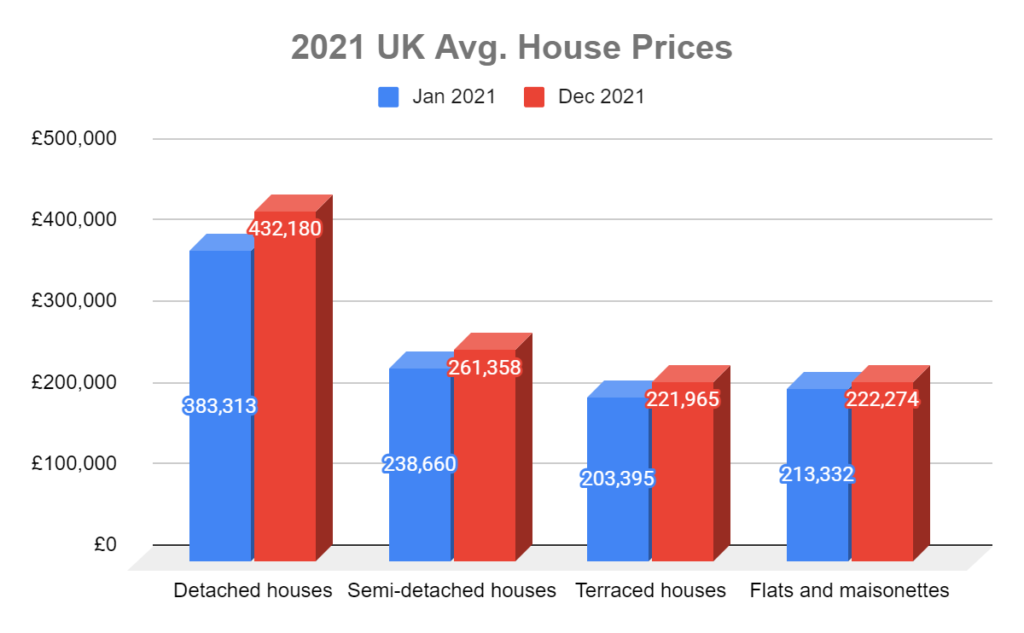
Percentage Change by Property Type

Annual House Price Change by Property Type
Annual Price Change by Property Type

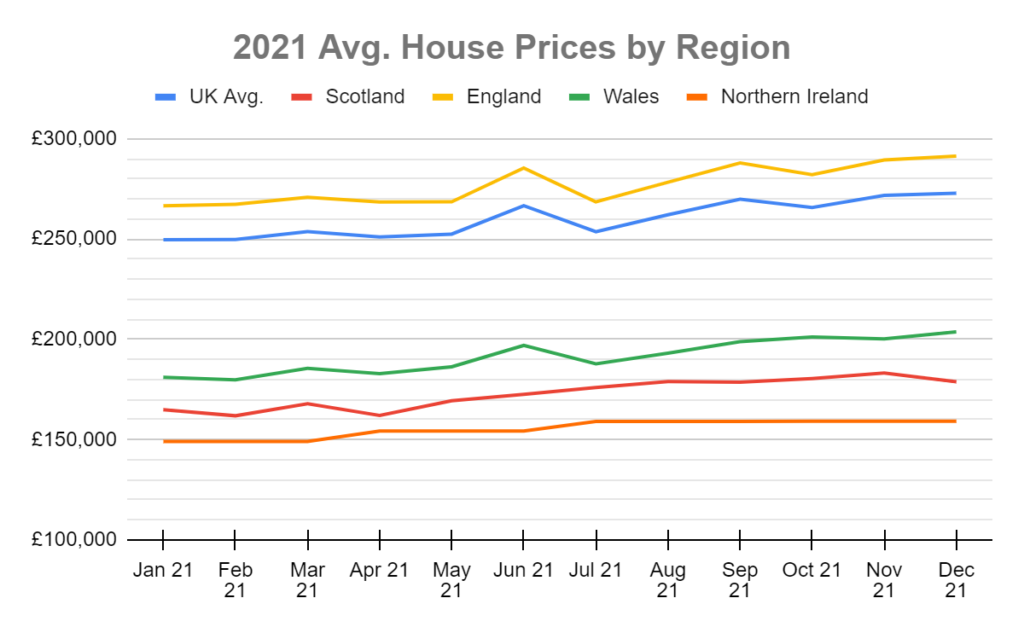
House Prices - England, Wales, Scotland & N. Ireland

Average House Prices_ England
Average House Prices_ Northern Ireland
Average House Prices_ Scotland
Average Property Prices_ Wales

House Prices by Region

Average House Prices_ London
Average House Prices_ South West of England
Average House Prices_ South East of England
Average House Prices_ East of England
Average Property Prices_ West Midlands
Average House Prices_ East Midlands
Average Property Prices_ Yorkshire and The Humber
Average Property Prices_ North West
Average Property Prices_ North East

House Prices in 2022

U.K Avg. House Prices 2022 graph

House Prices in 2021

uk avg house prices in 2021
Avg. House prices 2021 by region

House Prices in 2020

percentage house price growth change in 2020
house prices 2020 percentage graph country uk
house price changes england regions graph

Source: Land Registry

Use our U.K mortgage calculator to work out your monthly mortgage payments