Frisian
-
Posts
18 -
Joined
-
Last visited
About Frisian
-
Rank
Newbie
")
-
Wouldn't they also have to pay tax on the rental income? Probably 40%?
-
On the other hand some governments have the money at the moment to replace ageing nuclear weapons at a cost of upwards of £20 billion. The 'there is no money left' argument is conveniently used for all projects that the government does not consider a priority (such as providing decent and affordable housing for its population), but for other projects (such as developing WMD that are extremely unlikely to ever be used and may even be illegal under non-proliferation treaties) money is available. Of course there is also the jobs argument, but that obviously works for house construction as well, as ccc has pointed out. At any rate, we certainly shouldn't be duped into believing the government when it tells us for what projects there is money and for what there isn't.
-
I had also hoped that the spring bounce wouldn't materialize, but it did, with a vengeance. To cheer us up here's a graph with prices and YoY and quarterly changes for the Gorgie/Dalry 1-bed flats since 2005. £100K was breached in Q1/2006 and the peak was in Q1/2008 with £127K, so they're down 15% from peak.
-
The detailed report is still there under the House Price Table link: http://www.espc.com/EspcPageMedia/MarketWatch/StatsSummaryQ2-2010.png Gorgie/Dalry is down by 5.1% - not bad but way to go.
-
Here are the graphs from 1995 up to the latest quarterly report showing price developments for the four central Edinburgh districts. Little change from the previous quarter. Let's see about this year's spring bounce.


-
I quite like it - if all the people with too much money think they have to move into Quartermile then there will be more decent flats left for the hoi polloi elswewhere.
-
I wonder if the new HMO regulations are actually motivating some landlords to sell up: http://www.easier.com/65844-hmo-guidelines-hit-student-pockets.html
-
It needn't even be that prices are pushed up by tiny supply - maybe the 1 or 2 flats that did sell just happened to be bigger than those last quarter. I certainly hope that's the explanation
-
The quarterly stats are better than the monthly ones in that they do provide a breakdown of property types and areas (e.g., 2-bedroom flats in Bruntsfield/Marchmont). This breakdown shows that bigger propeties do skew the averages: for example, 3-bed semis in the suburbs went up 7.6% YoY, and 4-bed detached in the suburbs by 4.9%. Unfortunately, 2-bed flats in Bruntsfield/Marchmont went up by 10.7% YoY! But 1-bedders in Gorgie/Dalry/Leith Walk/Easter Road and 2-bedders in Stockbridge actually fell YoY. All of this with a large grain of salt since we're not given the sales volume anymore.
-
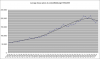
Here are the ESPC stats for the four central Edinburgh areas - Marchmont/Bruntsfield, City Centre, Leith Walk, Stockbridge, from 1996, updated for the Q4 2009 figures. Three graphs: 1) absolute prices, 2) YoY and quarterly changes, 3) change from peak in Q2/2008. There was a 1.1% increase YoY and prices are now at 87.5% of their peak value. It seems ESPC are no longer publishing details on number of sales, but the total number of sales was very similar to Q3 (~1,300).
-
There are two things worth mentioning here: 1. There seems to be a confusion with many estate agents and the press between rising sales volumes and rising prices (rises in sales are always touted as recovery in the housing market). I think this is far from the truth. With the currently low sales volumes prices will become skewed to more expensive properties who tend to hold up better than smaller, first-time buyer properties, and thus drive up the average house price. When sales volume increases it will probably increase at the lower end, thus driving down the average price. We'll see. In any case I don't buy the 'increased competition between buyers holding up prices' argument. In Q2 2009 ESPC sold 1,130 properties and they have 4,300 for sale. So they shifted about 25% of their stock - doesn't sound like much competition to me. 2. ESPC seem to be very bullish about rising sales volume. But in the spring bounce sales volume always goes up. If we look over history by how much sales volume has increased in Q2 compared with Q1 of that year, we find: 2005: 61% 2006: 79% 2007: 90% 2008: 30% 2009: 38% So this is not a very impressive increase in sales at all, compared with previous years. Now let's see how much sales volume has gone down between Q2 and Q3 of each year: 2005: 8% 2006: 6% 2007: 5% 2008: 36% 2009: ? If 2008 is anything to go by, this will be a quiet summer.
-
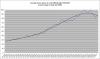
Here are my graphs from 1995 onwards updated for Q2 2009. These are for the four central Edinburgh areas. In central Edinburgh there was a spring bounce; prices are up 7.4% from Q1. This compares with spring bounces of 5.6% in 2008, 6.6% in 2007, 9.4% in 2006 and 5.7% in 2005. The biggest spring bounce 'ever' was in 2002: 14%, closely followed by 1999 with 12.7%. There was no spring bounce this year on Leith Walk and in Dalry. Sales volume is down 65% from Q2 2007. The first graph shows the average house price in central Edinburgh from 1995 to 2009. The second shows YoY and quarterly percentage changes. The third one shows prices as % of peak value (Q2 2008). Prices are now down 13.1% from peak and are back to Q4 2006 prices. The nice thing is that we'll probably have three quarters of straight falls now.

-
One of the Charles Lawson offices on Cowley Road has also closed down, I saw today.
-
In fact the 6.8% YoY decline is quite misleading since it includes the low-volume and volatile suburb market and since the cheap Leith Walk category was left out of this year's average but included in last year's. Comparing like with like in the central Edinburgh categories there was a YoY decline of nearly 15%. Prices in central Edinburgh are now barely above Q2 2004. The crash here started later but is quite a bit steeper than elsewhere. So indeed, 'Edinburgh is different'
-
Here are the two graphs I posted recently, now updated with the new figures for Q1 2009. As before, all data are the average prices for the ESPC's central Edinburgh categories, that is, Marchmont/Bruntsfield 2 bed, Gorgie/Dalry 1 bed, Leith Walk/Easter Rd 1 bed, Stockbridge/Comely Bank 2 bed, and city centre all. One shows the average price for these flats from 1996-2009 (with a trend line), the other the quarterly and YoY changes. Apparently there was no sale at all in Q1 2009 for the Leith Walk/Easter Road category (!), so I used the figure from Q4 2008. This means that the rate of decline in the graph is most likely an underestimate. And ESPC are clutching at straws. The chief executive asserts that 'it‟s important to note that the average house price has remained stable over the last 6 months.' Yet for central Edinburgh the reason for this is simply that they omitted the comparably cheap Leith Walk category from their average this quarter, since there were no sales. If we remove Leith Walk from Q4 2008 as well, we find a fall of average prices in Edinburgh from Q4 2008 £199,467 to Q1 2009 £186,837, a decline of 6.3%. For central Edinburgh, prices are now down to nearly Q1 2006 levels (which were about the same as Q2 2004). And this is not accounting for inflation. The Q1 2009 report by ESRC is a good read: sales volume down almost 50% YoY, 70% fewer properties coming onto the market than last year, only 20% of houses achieving their fixed price and average offers over premium just 3.3%. Let's see if the spring bounce in Q2 will materialize.