the_duke_of_hazzard
-
Posts
6,159 -
Joined
-
Last visited
Content Type
Profiles
Forums
Events
Everything posted by the_duke_of_hazzard
-
It means the property hasn't been 'seen' by my software yet (it updates about every two hours). Of course, this is only for London properties, so if the property is outside London it will 'never' be processed (unless I expand the range).
-
The RIghtmove London Property Notes plugin now shows possible duplicate listings. For example, I just saw from a quick search that this property currently for sale at 485K: https://www.rightmove.co.uk/properties/143029373#/?channel=RES_BUY was up for rent earlier last year for £1850pcm. https://www.rightmove.co.uk/properties/133264670#/?channel=RES_LET Below is an example output Get it here: https://chromewebstore.google.com/detail/rightmove-london-property/ddnkogahnfkgkechllbdfgacnkikddbf

-
Sorry, I mistook apps as 'applications'. So you think the NW figures will fall again? I can't really see the numbers in the graph.
-
Where are the application figures?
-
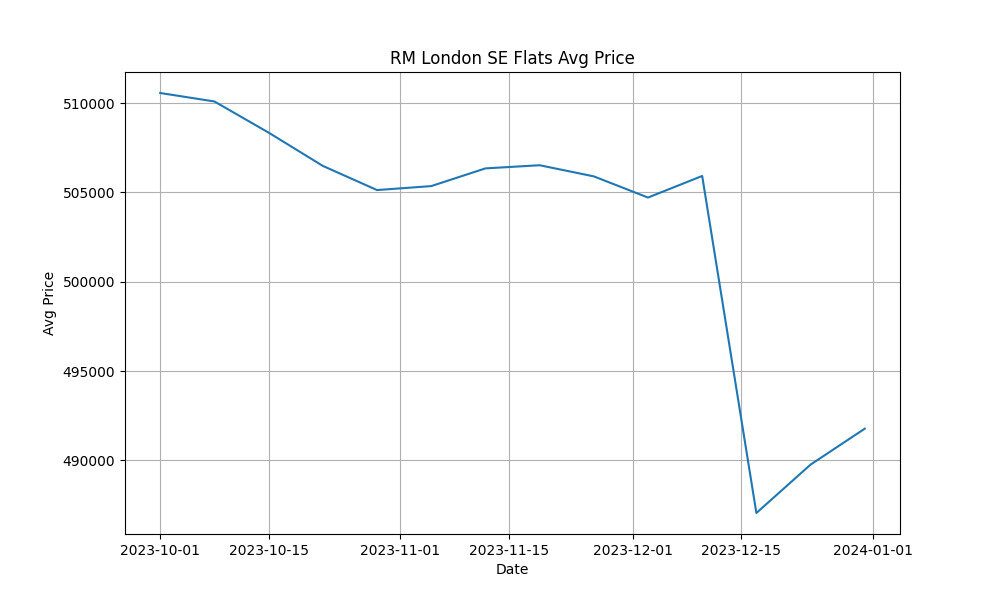
Thanks. Indeed that does change things. For SE ppsqft, for example: And for all London properties (arithmetic vs geometric vs median):


-
Yes, indeed, the count went down significantly, albeit with many new postings on Boxing Day. The ppsqft figure should adjust for this, though. Or properties that came on are more optimistically priced over xmas. I guess next year I'll have a better idea.
-
Not to that granularity and no ppsqft either. I should have also said that this takes into account asking price changes, in contrast to righmove's index.
-
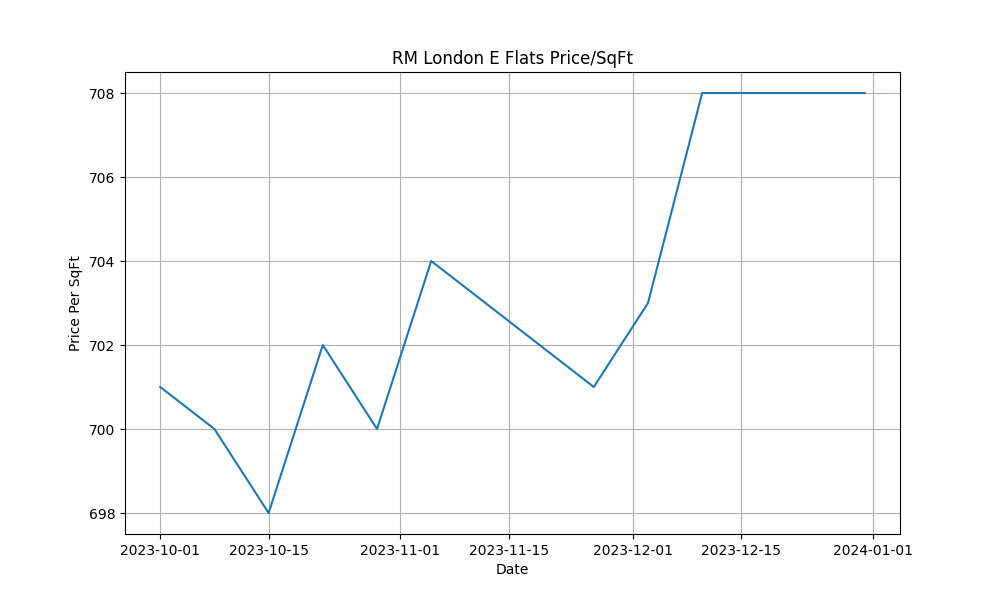
There's graphs for all combinations. LMK if you are interested in any specific ones.
-
E (not EC) postcode flats:

-
SE postcode flats:

-
ALL for houses:


-
Here's averages for ALL locations for flats:


-
Based on the work I did for my Chrome plugin (https://chromewebstore.google.com/detail/rightmove-london-property/ddnkogahnfkgkechllbdfgacnkikddbf) I've built an index of London asking price data and price per square foot. It's updated weekly. I only have data since October, so I can't see what happens at the end of the year typically, but there is definitely an upward trend since November. Here's the raw averages for ALL properties in ALL of London:


-
Thanks! I'm getting sqft from plans, or inferring it using ML algorithms. I could add energy rating, but it wouldn't be high on my backlog
-
New version of this out today. https://chromewebstore.google.com/detail/rightmove-london-property/ddnkogahnfkgkechllbdfgacnkikddbf The details look like this now, with colours to make it easier to read:

-
Why does the report say London has dropped QoQ?
-
New version of this available today, with price per square foot and a few other improvements https://chrome.google.com/webstore/detail/rightmove-london-property/ddnkogahnfkgkechllbdfgacnkikddbf
-
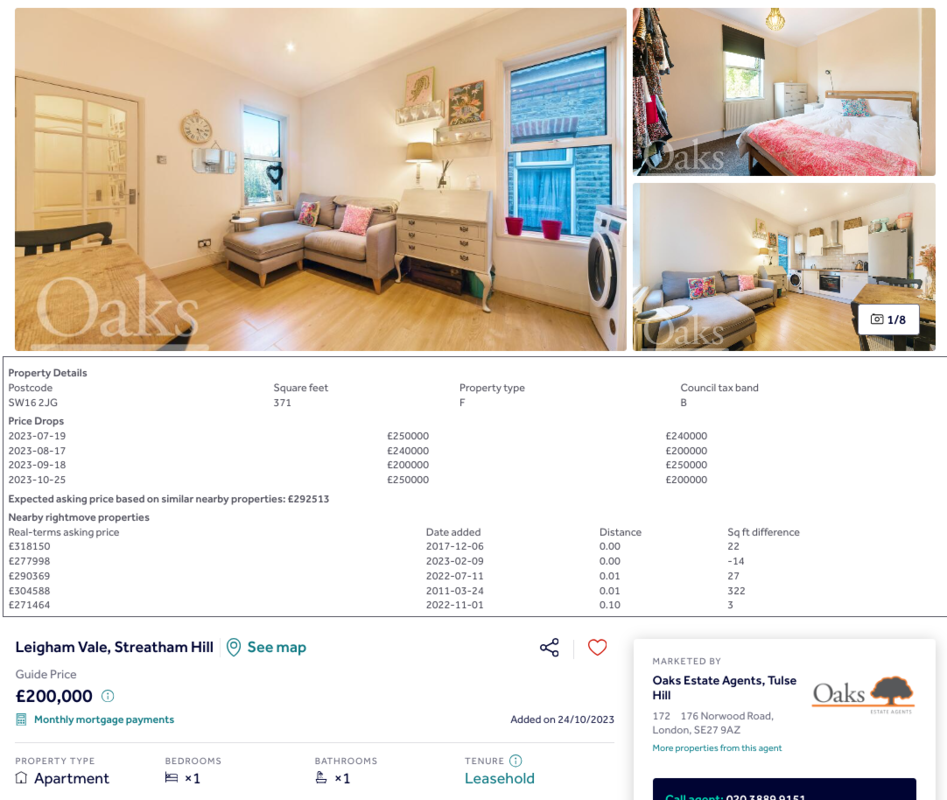
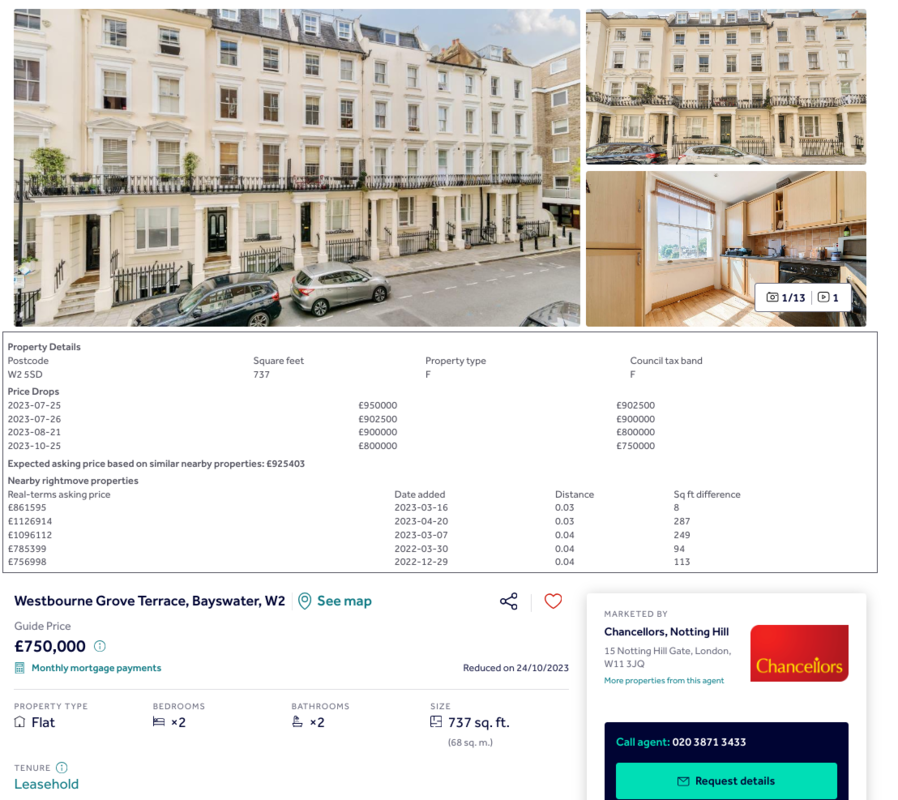
Examples of big & multiple drops
the_duke_of_hazzard replied to user not found's topic in House prices and the economy
Some more droppers in London around the 20% mark:
-
Examples of big & multiple drops
the_duke_of_hazzard replied to user not found's topic in House prices and the economy
Some more droppers in London around the 20% mark:
-
Examples of big & multiple drops
the_duke_of_hazzard replied to user not found's topic in House prices and the economy
Some more droppers in London around the 20% mark:
-
Examples of big & multiple drops
the_duke_of_hazzard replied to user not found's topic in House prices and the economy
Some more droppers in London around the 20% mark:
-
Examples of big & multiple drops
the_duke_of_hazzard replied to user not found's topic in House prices and the economy
This one made the news a while ago, a zero-bed bit of outside space in SW7. Note the 30% drop before sale... Info at the bottom is from my Chrome plugin: https://chromewebstore.google.com/detail/rightmove-london-property/ddnkogahnfkgkechllbdfgacnkikddbf?hl=en-GB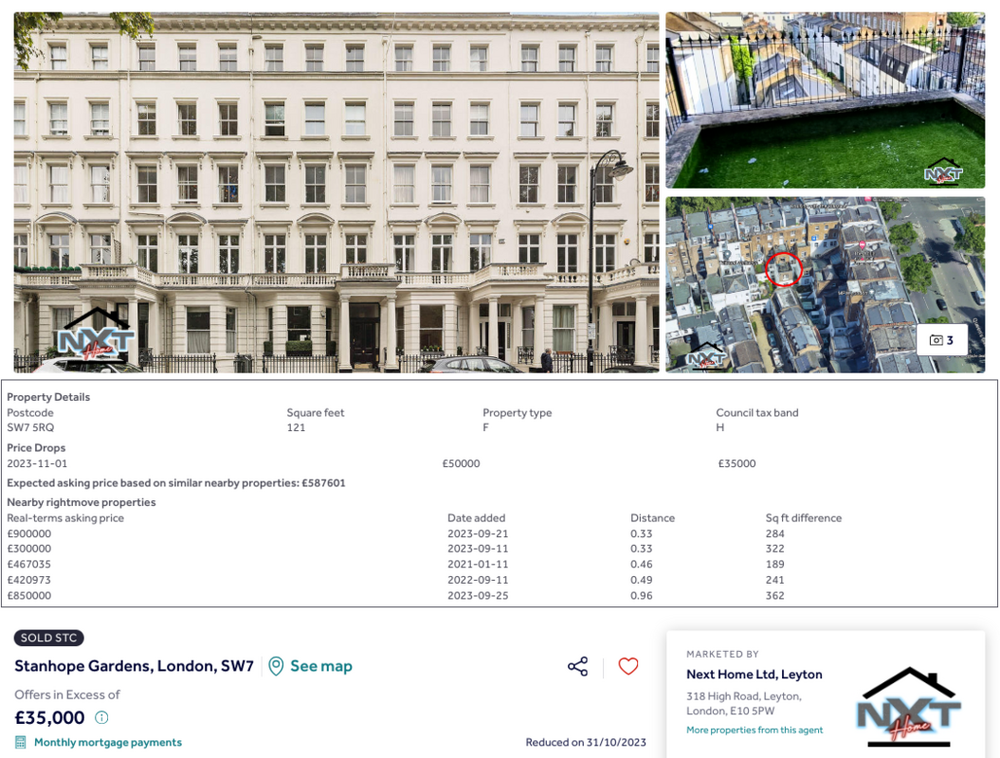
-
'Inflation' Down To 3.9%??
the_duke_of_hazzard replied to Social Justice League's topic in House prices and the economy
Well, my shelter inflation is zero, and energy is lower than 12 months ago. Travel is indeed up (travelcard) but petrol is also lower. -
'Inflation' Down To 3.9%??
the_duke_of_hazzard replied to Social Justice League's topic in House prices and the economy
The methodology (mine and the ONS's) accounts for that. I'm losing count of the number of times I have this argument with people. -
'Inflation' Down To 3.9%??
the_duke_of_hazzard replied to Social Justice League's topic in House prices and the economy
I believe the official figures. My shopping bill has been static or falling for a few months now.