

VedantaTrader
-
Posts
1,108 -
Joined
-
Last visited
Content Type
Profiles
Forums
Events
Posts posted by VedantaTrader
-
-
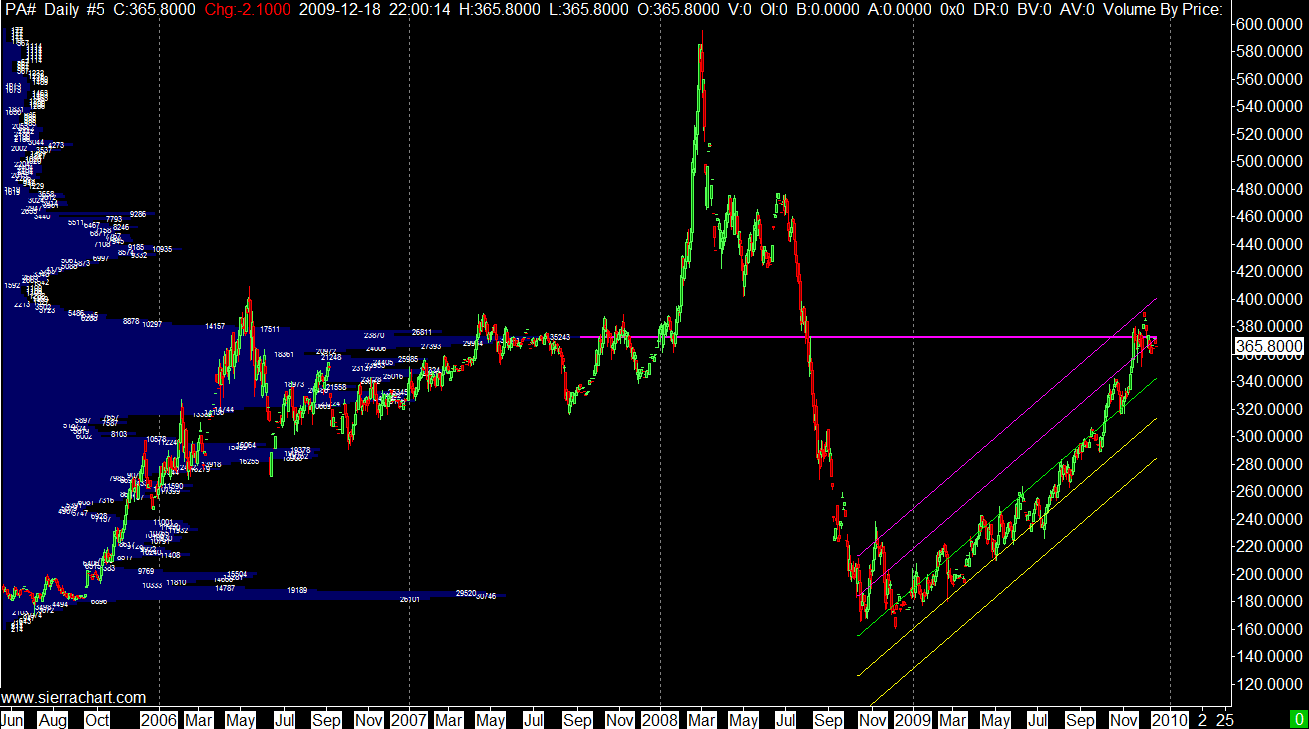
Hi PP, ah really your DoubleAgent, its a small world,haha...been quite hectic last few days I ll respond to this properly tomorrow night. I can't do it justice right now...Just one quick chart with some linear regression channels and volume by price. I would be on the side of a correction in palladium to "at least" 340USD...We are certainly at a point where is there is an equilibrium between accumulators and distribution. I would say that this week will start to balance or break this equilibrium between buyers and sellers...and I m more inclined to say to the downside, how much I don't know, but certainly 340 is a good place to start, failing that perhaps more. The other thing that cannot be ruled out is another spike up, however, if that happens(which I don't think it will, nut who knows) and I see a divergence between volume/price relationship then I think it will be a strong sell signal. For now though I d rather sell with a tight stop than be a buyer.
This chart shows that this price level is an area of very high volume. Its an area in palladium where buyers/sellers love to meet and have a good old tug of war with the price. The bottoming area last November you notice also was a very high area of volume. Usually when these battles between the bulls and bears conclude its possible a "biggish" move can occur. Other volume behaviour to me says it is ripe to correct, between 350-360 seems like a good area to be short, perhaps on a four chart, or an hourly chart with some nice trend indicator overlayed.
-
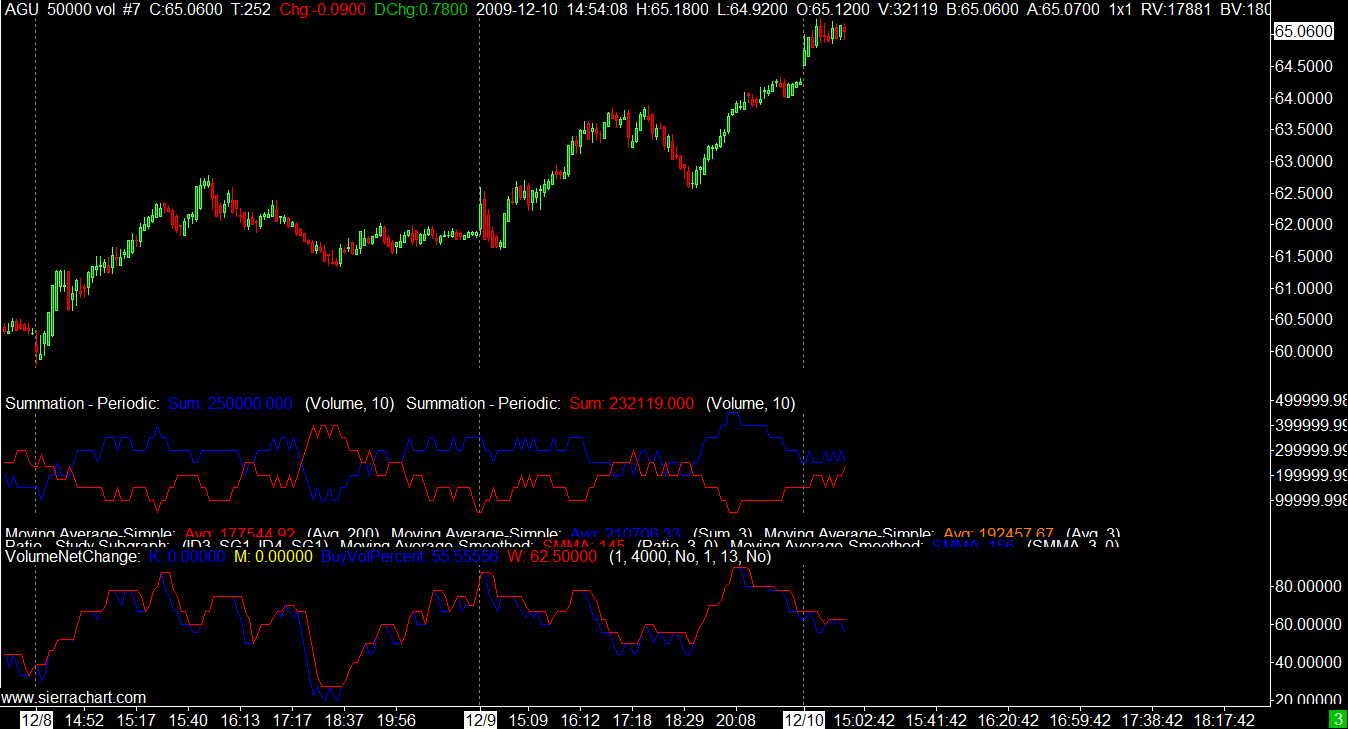
And the correction occurs. I m going to make a post about volume and offer some food for thought hopefully. I m testing in real time intraday as the markets are fractal. To test in real time EOD day takes too long...However, I would hope to apply more to daily charts...Anyway the market did correct from that level based on the volume analysis, that 5 or 6 candle correction to me could easily be a 5 or 6 day correction applying the same method to a daily chart, which could be a healthy profit. Just by going intraday I can find out about it more quickly. Even on that intraday basis it was a move of 120 cents which with a CFD or spreadbet lot would be a nice profit.
-
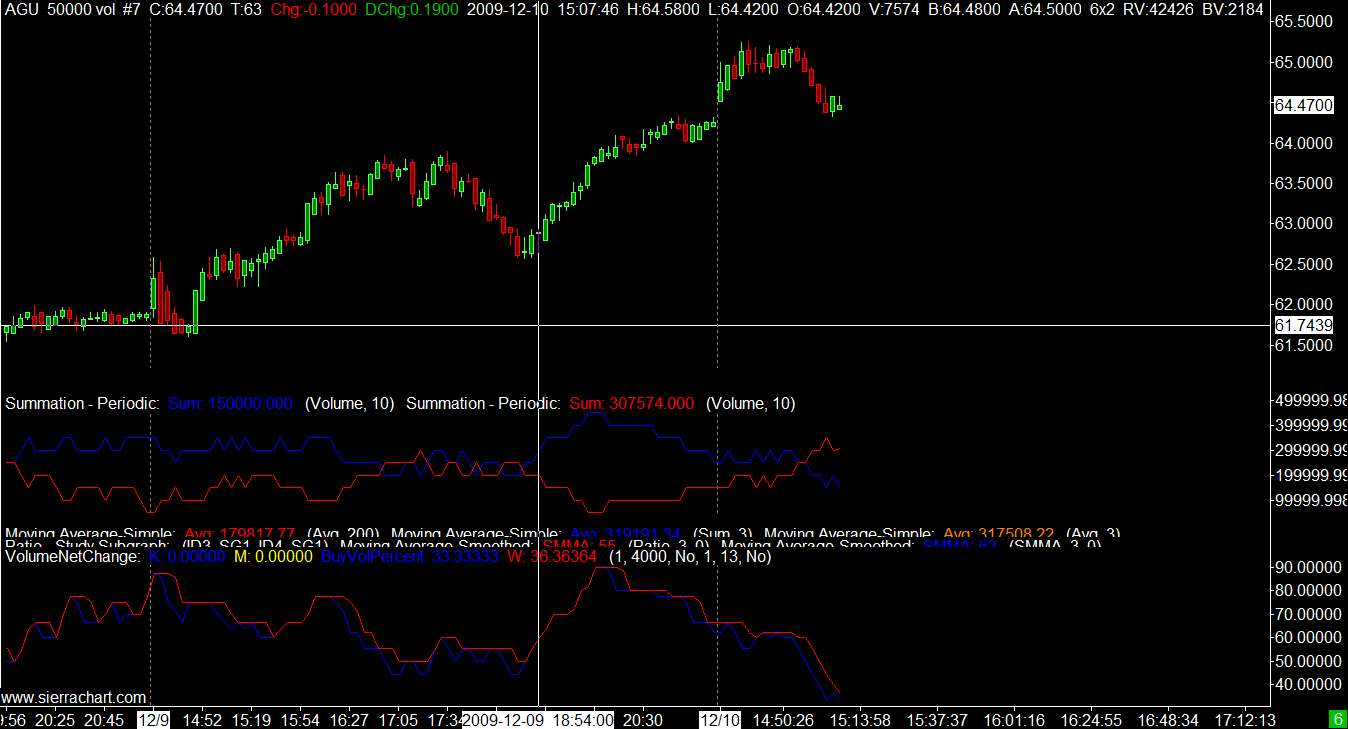
As an example Agruim stock i think will fall from intraday pretty soon based on volume, but the reason that won't be true is if new volume comes into the market...up to the minute as of now...I m just talking a small intraday correction at least...My confirmational bias is based on my reading of volume...but the unknown is new volume which gives me the balance to be flexible if its wrong. Just thought it was an interesting idea.
-
Thankyou for that VT. It looks very interesting.
It did try the igindex trading tool at one time - but it was very clunky. I had to dust off my old programming skills. Not sure I trust enough to allow their system to trade automatically for me though.

Did enough to find out that whatever TA I read in a book when back tested seemed to lose more money than it gained e.g. ma crossovers, rsi coming back from oversold etc. But I didn't stick with it for long because it was very painful to work with. I thought I might try going down a completely different route entirely.
I currently use google spreadsheet for some really simple stuff - but it only uses 20 minute delayed data.
Inuitively I'm of the opinion that lots more data does not necessarily make you a better trader. Plus I think that on average you may have to have slightly longer timescales if you are to have any hope of covering your costs. Are these issues for you?
I am minded to chance my arm though and might check it out in more detail sometime as you're here. Is it only us securities though?
Hi HAM, you can get LSE also, it just depends on who you use for the data feed. I use Barchart.com for most but use Mytrack for LSE...So I have two incidents of the program on my desktop so I can connect to the two seperate data feeds. I highly recommend you try it, there is a free trial so nothing to lose and much to gain

Now that is interesting that you know some programming. I dont and TBH think it looks really difficult. But maybe not. I can do the simple indicators using excel. Your right the indicators don't work in back testing. The human eye will pick out from a chart the times it does work...a confirmational bias...which brings me on to something I was reading today...
Confirmational Bias in trading...Interesting article on the subject
I think we are all guilty of it in all walks of life. For example I think Arsenal will win the league, what you think Red karma,haha?
In trading it plays a huge part. One way around it is to make your decision on a trade, and then go and find all the reasons that could stop it from working.
-
Ah yeah and a good scanner to find whatever you want. If you want to scan the NYSE or the LSE for example to find a stock that has made a doji top, on low volume with an RSI divergence then you can do it.
-
I see you use sierracharts. How do you find that? What does it allow you to do? What indicators/data is there that is not on stockcharts say that is readily manipulable by their platform?
I m going to be biased because I really love it...But it is just so good IMHO, of course
 Its just so customisable...Has a whole host of studies...Is real time data free with stockcharts? I don't know much about it.
 I get real time data CBOT, NYSE, LSE, Foreign Exchange, Amex...and delayed data and EOD for any markets I dont subcribe to. Attachment is of the excel worksheets that are built in and update whatever data on them in realtime right down to 1 second/tick data. This means you can create statistical analyse, write indicators, reference other charts from etc etc and just about all the things you can do in excel only it will plot it on your chart...in real time...
Other things like loop functions, arrays...and C++ to customise just about anything you want, from backtesting systems if you can do that to writing systems that are fully automated. Also you can create real time alerts based on any parameter you want...It also has a trading window where you can trade from the chart in simulation mode also. Just right click and move the line to the price click and your done...plus a whole host of order types. Also using the worksheets you can reference other charts to do risk and money management.
I also like the reference other charts study...and the number of charts you can do. You can create a candle based on any number of volume contracts rather than time, renko, tick charts, point and figure, two types of range charts, time charts, three line break charts. The data feed which is external are of good quality as you are not getting inhouse data but data from the exchange.
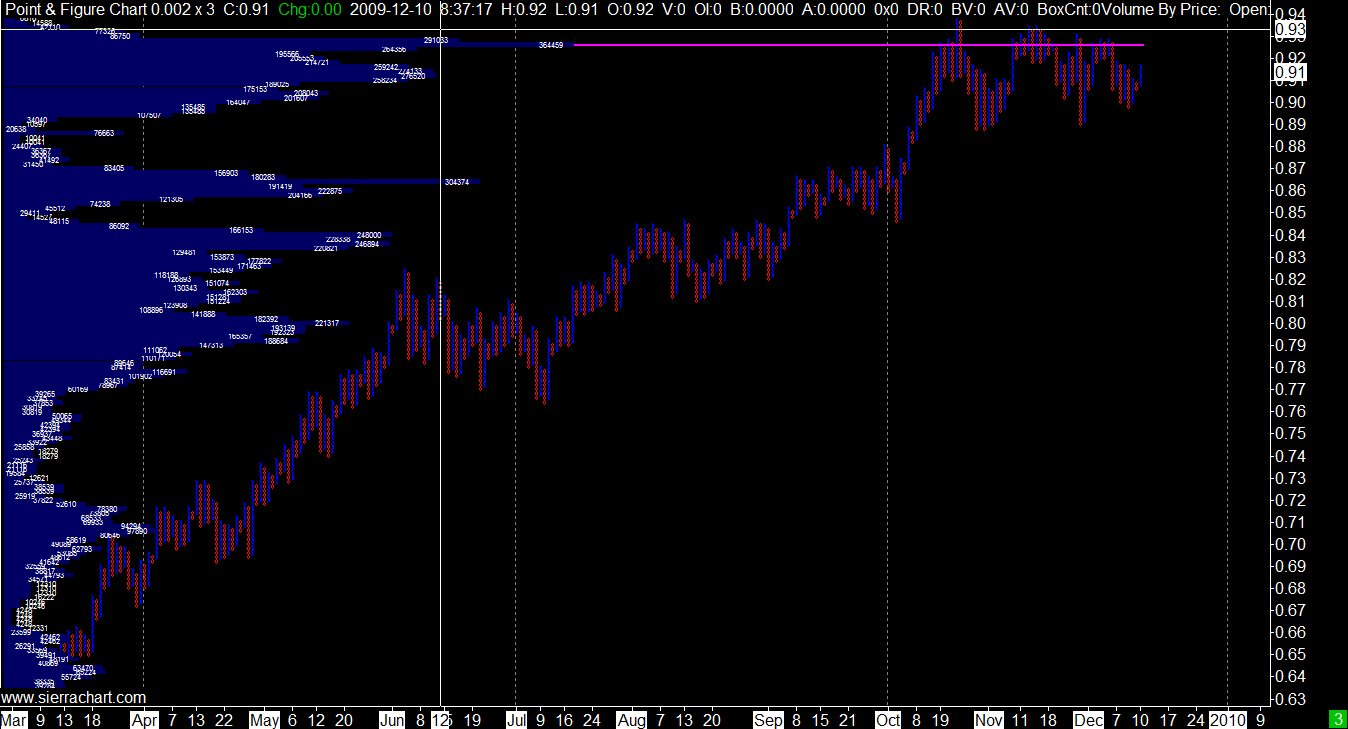
example on thing I like is this..Point and Figure with 20 pip box size...for the CME AUDUSD...The volume by price indicator is set to 20 pips also...This means you can see the volume contracts at that price increment of 20 pips...you can do this for any number of pips...it is interesting to see how much volume is at a certain price bracket. The pink line is the POC(point of control) which is the highest volume in the time period that the chart is zoomed to. Its good to know where the volume is at, and where it is not at. Plus there are so many different volume studies...
It is basically a package with a bit of a learning curve...but well worth it. Thats only some of the things...It is quite a alrge program where anyone can find the tools or create your own to express your own concepts and beliefs about the markets.
Try the free trial
-
What trading foum(s) do you visit/recommend by the way?
Good to see you also KR...So that actually seems to be it? They usually are something as old as the hills and very simple. It could quite easily have been the MA's or ATR system...
I don't really post too much on the forums, but visit them from time to time...Elitetrader is quite good if you go through the noise. Alot of bickering and egos on there....
Trade2Win is good, but its very quiet these days, but still good posters on there...
Forexfactory actually seems quite good also...ForexFactory
The best one seems to be Traderslaboratory which I have just signed up for. TradersLab
WealthLab seems good for trend following of course it is a seperate expensive piece of software, but some good info on trend following systems
-
Not even close? Hmmm.......I'm fairly sure that's what he's doing. Yes, it will be hopeless during sideways trends. I guess he's trying to get his customers into the big trend moves. With his laid back style I thought the 90 second speed video was amusing although he needs to change the music to something a little more avantgarde perhaps?
(not banjo)
Someone on a trading forum said that it was based on 3 higher closes on each timeframe...I didnt verify this as I don't use it. Perhaps three higher closes would often result in a SAR reversal alot of the time anyway?
-
probably a stupid question but can you guys help me out with a simple explanation as to why the dma is different depending on the chart being looked at? I mean why is the 100 or 200 dma of a different value on the hourly/daily/weekly charts? surely it the same average based on price? Whilst on a roll with stupid questions, is there a reason that I can't get 200 dma on my monthly charts?
Thanks
If I understand you right Richyc, it is because the 200dma will be based on 200 hours on an hourly chart, 200 days on a daily chart, and 200 minutes on a 1 minutes chart.
200 Month Dma...well you most likely havent enough data. You would need 200 months of Open, high low close data or just closing price data for each month before the average would show up. Thats 16 years before it will even start to draw on the chart...
As an example of what maybe you were trying to achieve
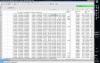
This is a daily chart of the S+P future...The orange line is referencing a weekly chart with a 10 week simple moving average...This means that the 10 week moving average is now being drawn on the daily chart. Thats why it looks less "smooth" and more step like. Its actually a very useful tool being able to look at different studies on one chart to give an easier way to analyse a market, it certainly is something that can be used in developing a trend based system.
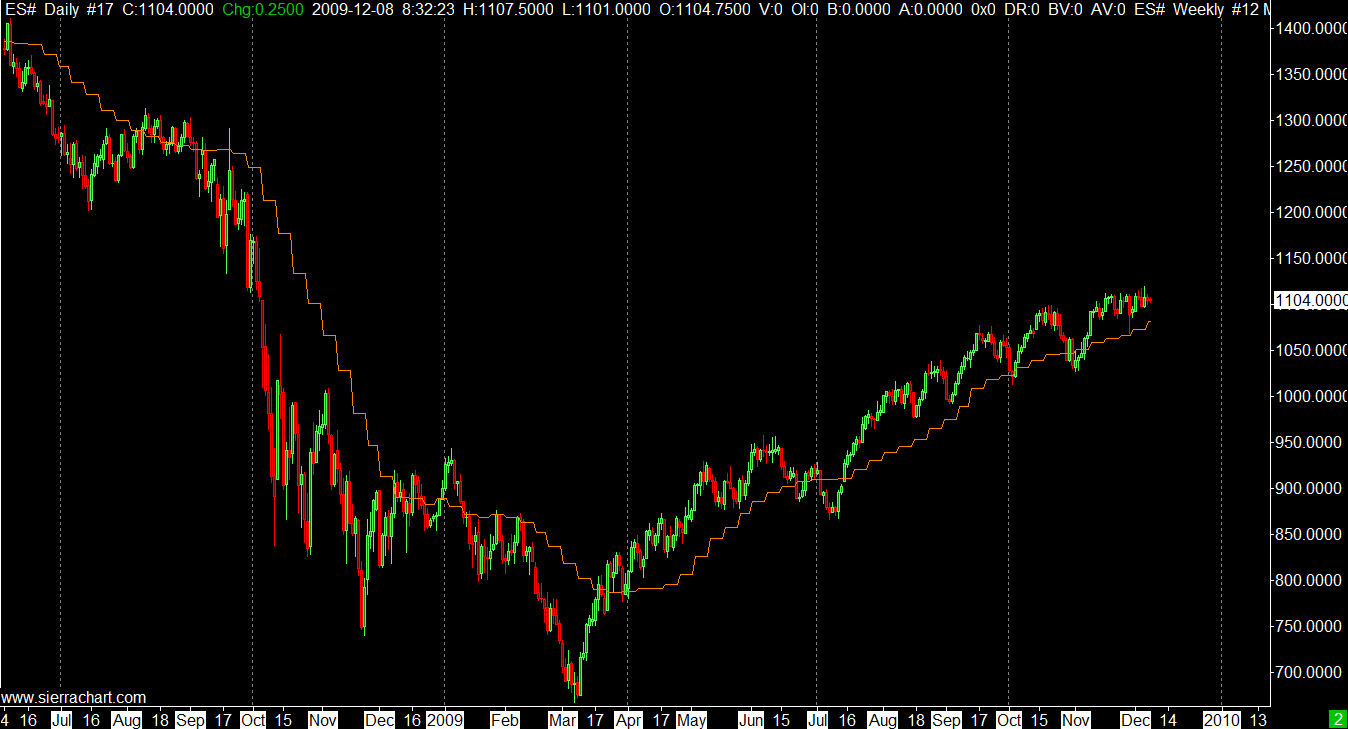
Here is another example with the RSI on daily chart but referencing the RSI from the weekly chart. The thing to remember is that when you overlay an indicator on a chart it will be based in the data within that chart.
-
Hi Guys, have you room for one more on this thread? GEI, as Hotairmails knows has become a bit of mud slinging "trade", and "volumes" are low. It seems that opinion is taken as heresy by many posters on there, which is a shame as there are some very good posters amongst the noise...
I have been working on quite a few indicators of late and this seems like a more enviromentally friendly place to host your views and ideas and to offer food for thought. I have always liked Red Karmas relaxed views to trading and open attitude and you guys seem open to learning about new stuff and discussing ideas...Hotairmail seems to be thirsty for knowledge and has a high degree of curiosity and offers some really good posts and good material on things.Although I m still learning about the economic side of things the last 6 months I have been realising I m much better aligned to more technical mechanical based systems with a dollop of discretion thrown in. Of course the fundamentals are more suited to longer term views...my problem has been aligning the time frames between technical based decisions and fundamental based decisions...I think at heart I m more short term, the swings lasting hours, days and sometime weeks...It is hard to reconcile longer term economic fundamentals, although its very useful to be aware of them.
Paul Tudor Jones in MArket Wizards said that the best risk/rewards are at turning points...So it is interesting that HAM is searching for ways to pinpoint bottoms and tops. It has been something that for many traders, myself included in that has been the bane of trading. MAny warn against it, more experienced and richer than us...due to the blackswan events and the fact that markets can move much faster and further than we can expect. So I think it will be a good idea to study as many tops and bottoms, consolidation periods as possible and offer the characteristics that go with it...
One of the biggest things I have been trying to incorporate is volume. I have come up with a few ways to use this indicator and one of them is to find the turning points short and medium term.
-
Great Songs...My Bloody Valentine, Ride and Teenage Fanclub, great melodies must listen to Grand prix and Bandwagonesque soon again...and Dj Shadow is fantastic also.
Love this song...Love the guitar intro, the organ sound, and the way he comes in with the lyrics, and the way the song ends with the mix of organ, piano, guitars and those stereo effects come wizzing in from all angles like they are passing just over your head...(well it feels like that with the headphones on and last thing at night in a dark room, haha)
-
Great thread is right. Really liked that TalkTalk song. Cure great band,and BlueManGroup looked really powerful.
Sp posted Echo and the Bunnymen so might like this song as will PP...
Great Song
-
Love Primal Sream, the best stuff was Screamadelica,Vanishing Point and Xterminator...This song is fantastic live. I love the way the guitar sounds come in on the chorus...Fantastic...great idea for a thread by the way PP.
And a well known song from the early nineties done fantastically well with this great style of guitar by the late Eric Roche
-
Not a live price, that was 20:59 on Friday when the market closed (compared to 16:30 when the 'new day' for the FTSE began)
We'll know what the spreadbetters think 10:30 tonight
Lets see how the currency markets do at opening. I expect the AUDUSD to move lower on risk aversion, and also the JPY to strengthen. I m planning to short AUDUSD from these levels. The RBA have been too quick out of the blocks with this rate rise. It has led to alot of speculative money flowing into the AUD, which is benefitting from the funding currency's GBP, Euro and USD, JPY...I think we will see a violent reversal in this pair. However, the currency markets are where to watch for signs.
-
First it's 50% and now it's 75% - your understanding is most definitely flawed. To listen to you lot you'd think that if you travelled into the west you'd be lucky to see another human being! As I said to capitalism, check your facts. About 34% of the NI population lives in the Greater Belfast Metropolitan area (which includes Belfast, Castlereagh, Carrickfergus, Lisburn, Newtonabbey and North Down). This is a large proportion of the population but where these 50% and 75% figures come from I don't know but it's about time reality started to sink in.
It would seem Woodzer is right here. If we take the population according to the census at 1.8 million in NI, and the metropolitan area of Belfast at 580,000 (circa) according to ONS type statistics then it is even less than 30%...
However, while I see hear your frustration at this, I think central power is one those things that just seems to happen in every country where the capital city is. Its probably not as bad in Northern ireland as it is in many other places. I guess the location of Belfast at the coast(east), and where the main airports are, where the main road routes are at make it a place where business will gravitate towards. However, I guess the point about urban areas, is that that 30% lives on about 10% of the total land mass...NI Pop Density
However, urban mass is a good thing also. I have seen plenty of NI towns, Ballymena, Cookstown, Banbridge, Coleraine, if we wanted all towns like these without any major central area, I would not prefer that. I like the choice of food, bars, culture, restaurants, people you get in a city...The nightlife in the local towns and the safety aspect of going out to bars in NI towns is awful, they become ghost towns after 6pm where you ll struggle to find a place to get a coffee... Belfast is the only place I would go out, unless Portrush or Portstewart.
I dont come or live in belfast by the way...I m up towards the north coast, in County Antrim(north)
-
i finished uni in edinburgh and got a job as trainee "financial futures derivatives trader" in glasgow
so i took up a new build in "Dennistoun Village" lol for a year
http://www.dennistounvillage.com/Dennistoun%20Village.html
then a year in Onslow Drive in a really spacious old tenament building.
both flats were nice, area wasnt that bad 20 min walk to merchant city / strathclyde uni only downside nowhere nearby you would dare go for a pint!!
i think dennistoun has been touted as the new west end for 30 years.never going to happen
Ahh,...I know what you mean. Use to go to the Barrowlands for gigs, That pub just beside the Barrowlands, it was really dodgy...yeah, not too many pubs you would drink in around Dennistoun...
-
They are the people who work with the back office staff at experian and callcredit.co.uk, and it won't necessarily mean the credit file is bad, but they are covering alot of people in it as they dont know exactly who will default
So basically their risk profiling is ********, which is what many have said all along. The answer - raise everybody's rates. How sophisticated.
Rinse and repeat of mortgage debt.
To be honest, if you are credit worthy, you don't need to borrow at a yearly rate of 12.95%, 15.95%, 21.95% etc etc...if you are relying on paying interest monthly on a credit card, you are definitely not "risk free"
-
They are the people who work with the back office staff at experian and callcredit.co.uk, and it won't necessarily mean the credit file is bad, but they are covering alot of people in it as they dont know exactly who will default
So basically their risk profiling is ********, which is what many have said all along. The answer - raise everybody's rates. How sophisticated.
Rinse and repeat of mortgage debt.
I'd say it is at a level it should have been at before the bubble was blown. However, if you are truly credit worthy you will not get these letters, its not everyone...The average credit card rate is 18% across the board, with many people even at standard rates of 9.95%, some even 6.95%, but ironically full balance payers who maybe pay off in full a balance of over £1500 a month, so it does not matter what the standard rate is. However, you are right it is not perfect, but it is better than before.
-
Capital One have sent me a letter with notice of an increase in interest rate to 39.9%. WTF?
Fortunately my outstanding balance of £141 ain't much of an issue but holy heck.
Are they just keen to get rid of me as a customer? I have the ability to call a number and opt out of this interest rate at the expense of not being able to continue to use the account. No great loss.
Anybody have any idea what their current default rate is?
Thats high. I spoke to some people who work as underwriters in credit cards with a couple of the Uks biggest banks, and they said they are repricing peoples interest rates who they feel who are at risk of default, with an opt out option. They are repricing large groups of people very month. They are the people who work with the back office staff at experian and callcredit.co.uk, and it won't necessarily mean the credit file is bad, but they are covering alot of people in it as they dont know exactly who will default. But of all the customers that they reprice they know there will be X percentage that will default, but they dont know who, so they reprice people who most likely will not default...Of course with your balance it doesnt matter. Have you any other credit cards, without a balance but are active accounts? I know they look at potential debt now as a ratio to income, So if you have 5 credit cards all with 5 grand credit limits but only a balance of £1000 on one of them, they look at that as potential debt of £25,000, even though you only owe £1000...So if anyone has unclosed accounts sitting and you are not using them, probably best to close them before applying for more credit.
-
run that by me again please....or are you describing the hokey cokey...put your left money in, your left money out, in, out, in, out, shake it all about.
Haha, yeah I bet they don't want too many people to know that...but it works...
-
Simple solution is not to use the overdraft...or pay it all off with a credit card, and pay the interest on that instead...
The way I see it is this...If you put a £1000 in a month, and if you only put £500 in a month you can take it out and put it in again, and that makes a £1000.00...You can actually do this by the way...it works...
If you are putting in a £1000, it means you can get £5 a month which works out at an interest rate of 7% a year. So not bad if for people who can manage their finances...
-
this was my main motivation. i know he will be dying to get involved! but he cant!! whos that anonymous guest?!?!
48 User(s) are reading this topic
14 members, 33 guests, 1 anonymous users
I m a bit out of the loop...so why did DB leave, or was he banned...is that why he cannot come back?
As for whats going on...I still have a bias towards another period of liquidation in stocks...and assets in general. It is always worth playing the waiting game. I have been so tempted to jump in and short with each new up day ..I have once at the 38% FIBO but was of course caught out, as that did actually prove prove to be a fibo literally...had a tight stop so not too bad.
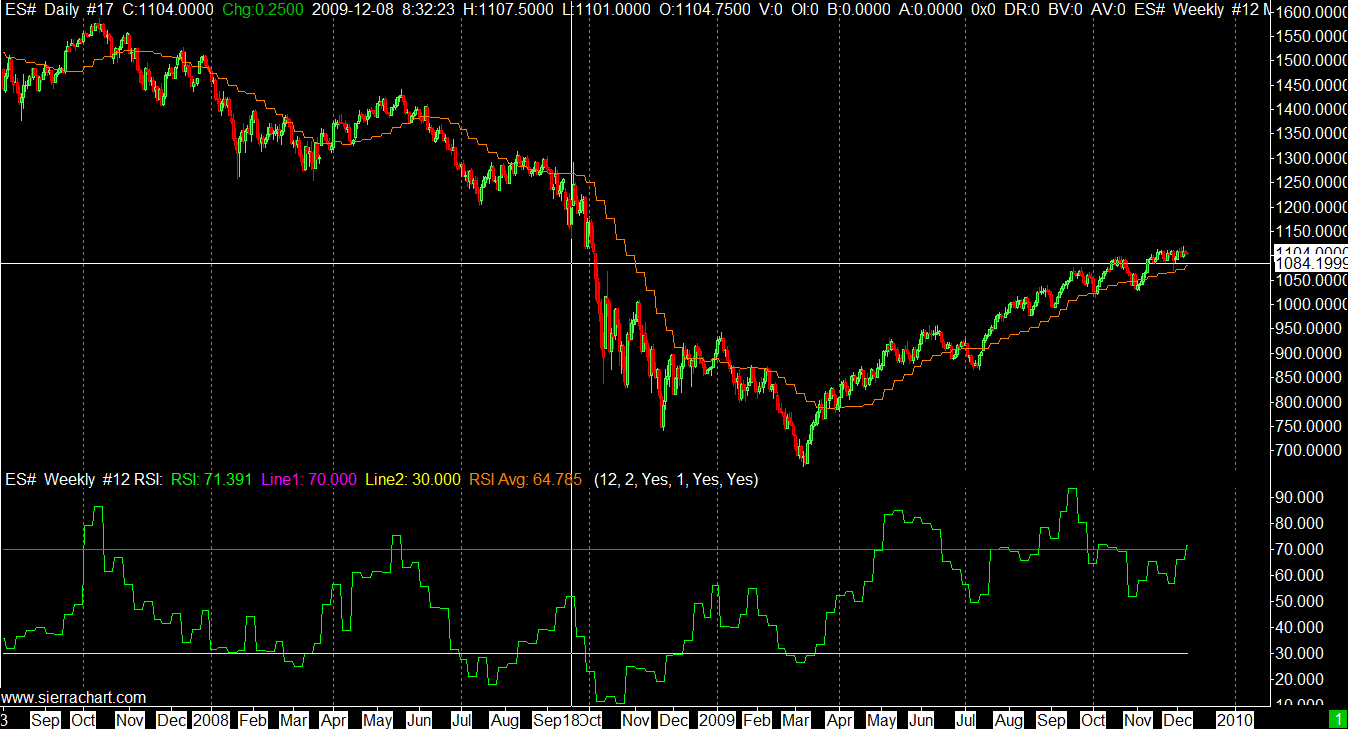
However, being hedged is the best way to go...Been long silver and gold, and short GBP/JPY...I m waiting for a change of trend on the weekly chart first, before searching for some intraday short. I think it has been hard watching this go up...however, they are designed to pull as many in as possible before delivering a sucker blow...so keep patient and lets see how it goes. We have the GBP/JPY and GBP/USD making a nice pull back...There is a chance that after this reversal and the GBP starts to move down, the markets will go with it.
There are so many technical and fundamental reasons why the market will go down, however, it does not mean the time is ripe for it to go down...not yet.
-
"or do you seltle for incorrectly taking the mick out of others."
That claim to be able to predict the market but can't? hell yes.
On my God mate...seriously get a life. Have you not got a family or any friends to hang out with. Right for two years you have been set in your mind that markets can't be predicted. No one is asking you to predict anything which is your right. I dont post that often on here these days...but everytime I do lurk on to the main board you are there going over the same thing again and again ad infinitum. It is like it has become an obsession. I remember listening to something on the Radio recently where it can become an addiction. I bet its one of the first things you need to do when you get up in the morning..."Must check HPC" to see who said anything that might be construed as a prediction.
My advice to you would be to take up a hobby, golf, football, snooker, get out get some fresh air, spend time with the family. You are probably in your forties now at a guess...I have seen many 40 plus year olds get crazy obsessions with things.
You seem to spend your whole life for the last 2 years as far as I can see posting 1 or 2 lines posts multiple times a day and for what? Let people make predictions if they want...no one is asking you do. Your life energy must be a smidgen of what it could be, spending all day being antagonistic, petty and negative to all around.
-
Confused
I was adding more and buying physical silver from the Guernsey Mint before Xmas around the 9 USD mark...And have held gold for while. The only short of note has been this one...3Rd July, short GBPJPY, check the time and date...
I actually went short before the 3rd July and have taken a further 3 shorts, leveraged at about 6:1. Those have done rather well
And silver well its doubled, although I think we could move down in the coming weeks, but lets see how price reacts at these levels.
So in terms of silver since Xmas and gold since a couple of years, this rally in the FTSE has been rather deflationary in terms of what I have bought....
You see it is not enough just to give a number like DOW 10,000, FTSE 5000. The number means nothing unless you are measuring against something else...In sterling its been inflation, in silver deflation...
CLARITY.com


Loopland Area East Belfast
in Northern Ireland
Posted
Thats a coincidence. Just noticed this thread...I remember turning on to the streets on Friday morning after waking up in a random house after a pretty heavy night(time of year and all that) out...when my mate and me were outside we called a taxi and looked up and it said Loopland Street...It seemed like a nice area. It was a two bedroom house which had been nicely refurbished lived in by 2 post student girls around 23-25. The areas seemed peaceful and nice in the morning. Never heard of the street until Friday morning, signed in here and I was like WTF...?